Fabric Widget
From the Fabric widget, you can:
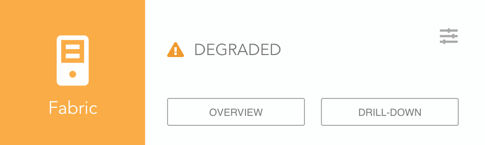
Monitor the overall health status for the Fabric Server.
View the health status for each parameter.
Configure the Fabric parameters to define their health status.
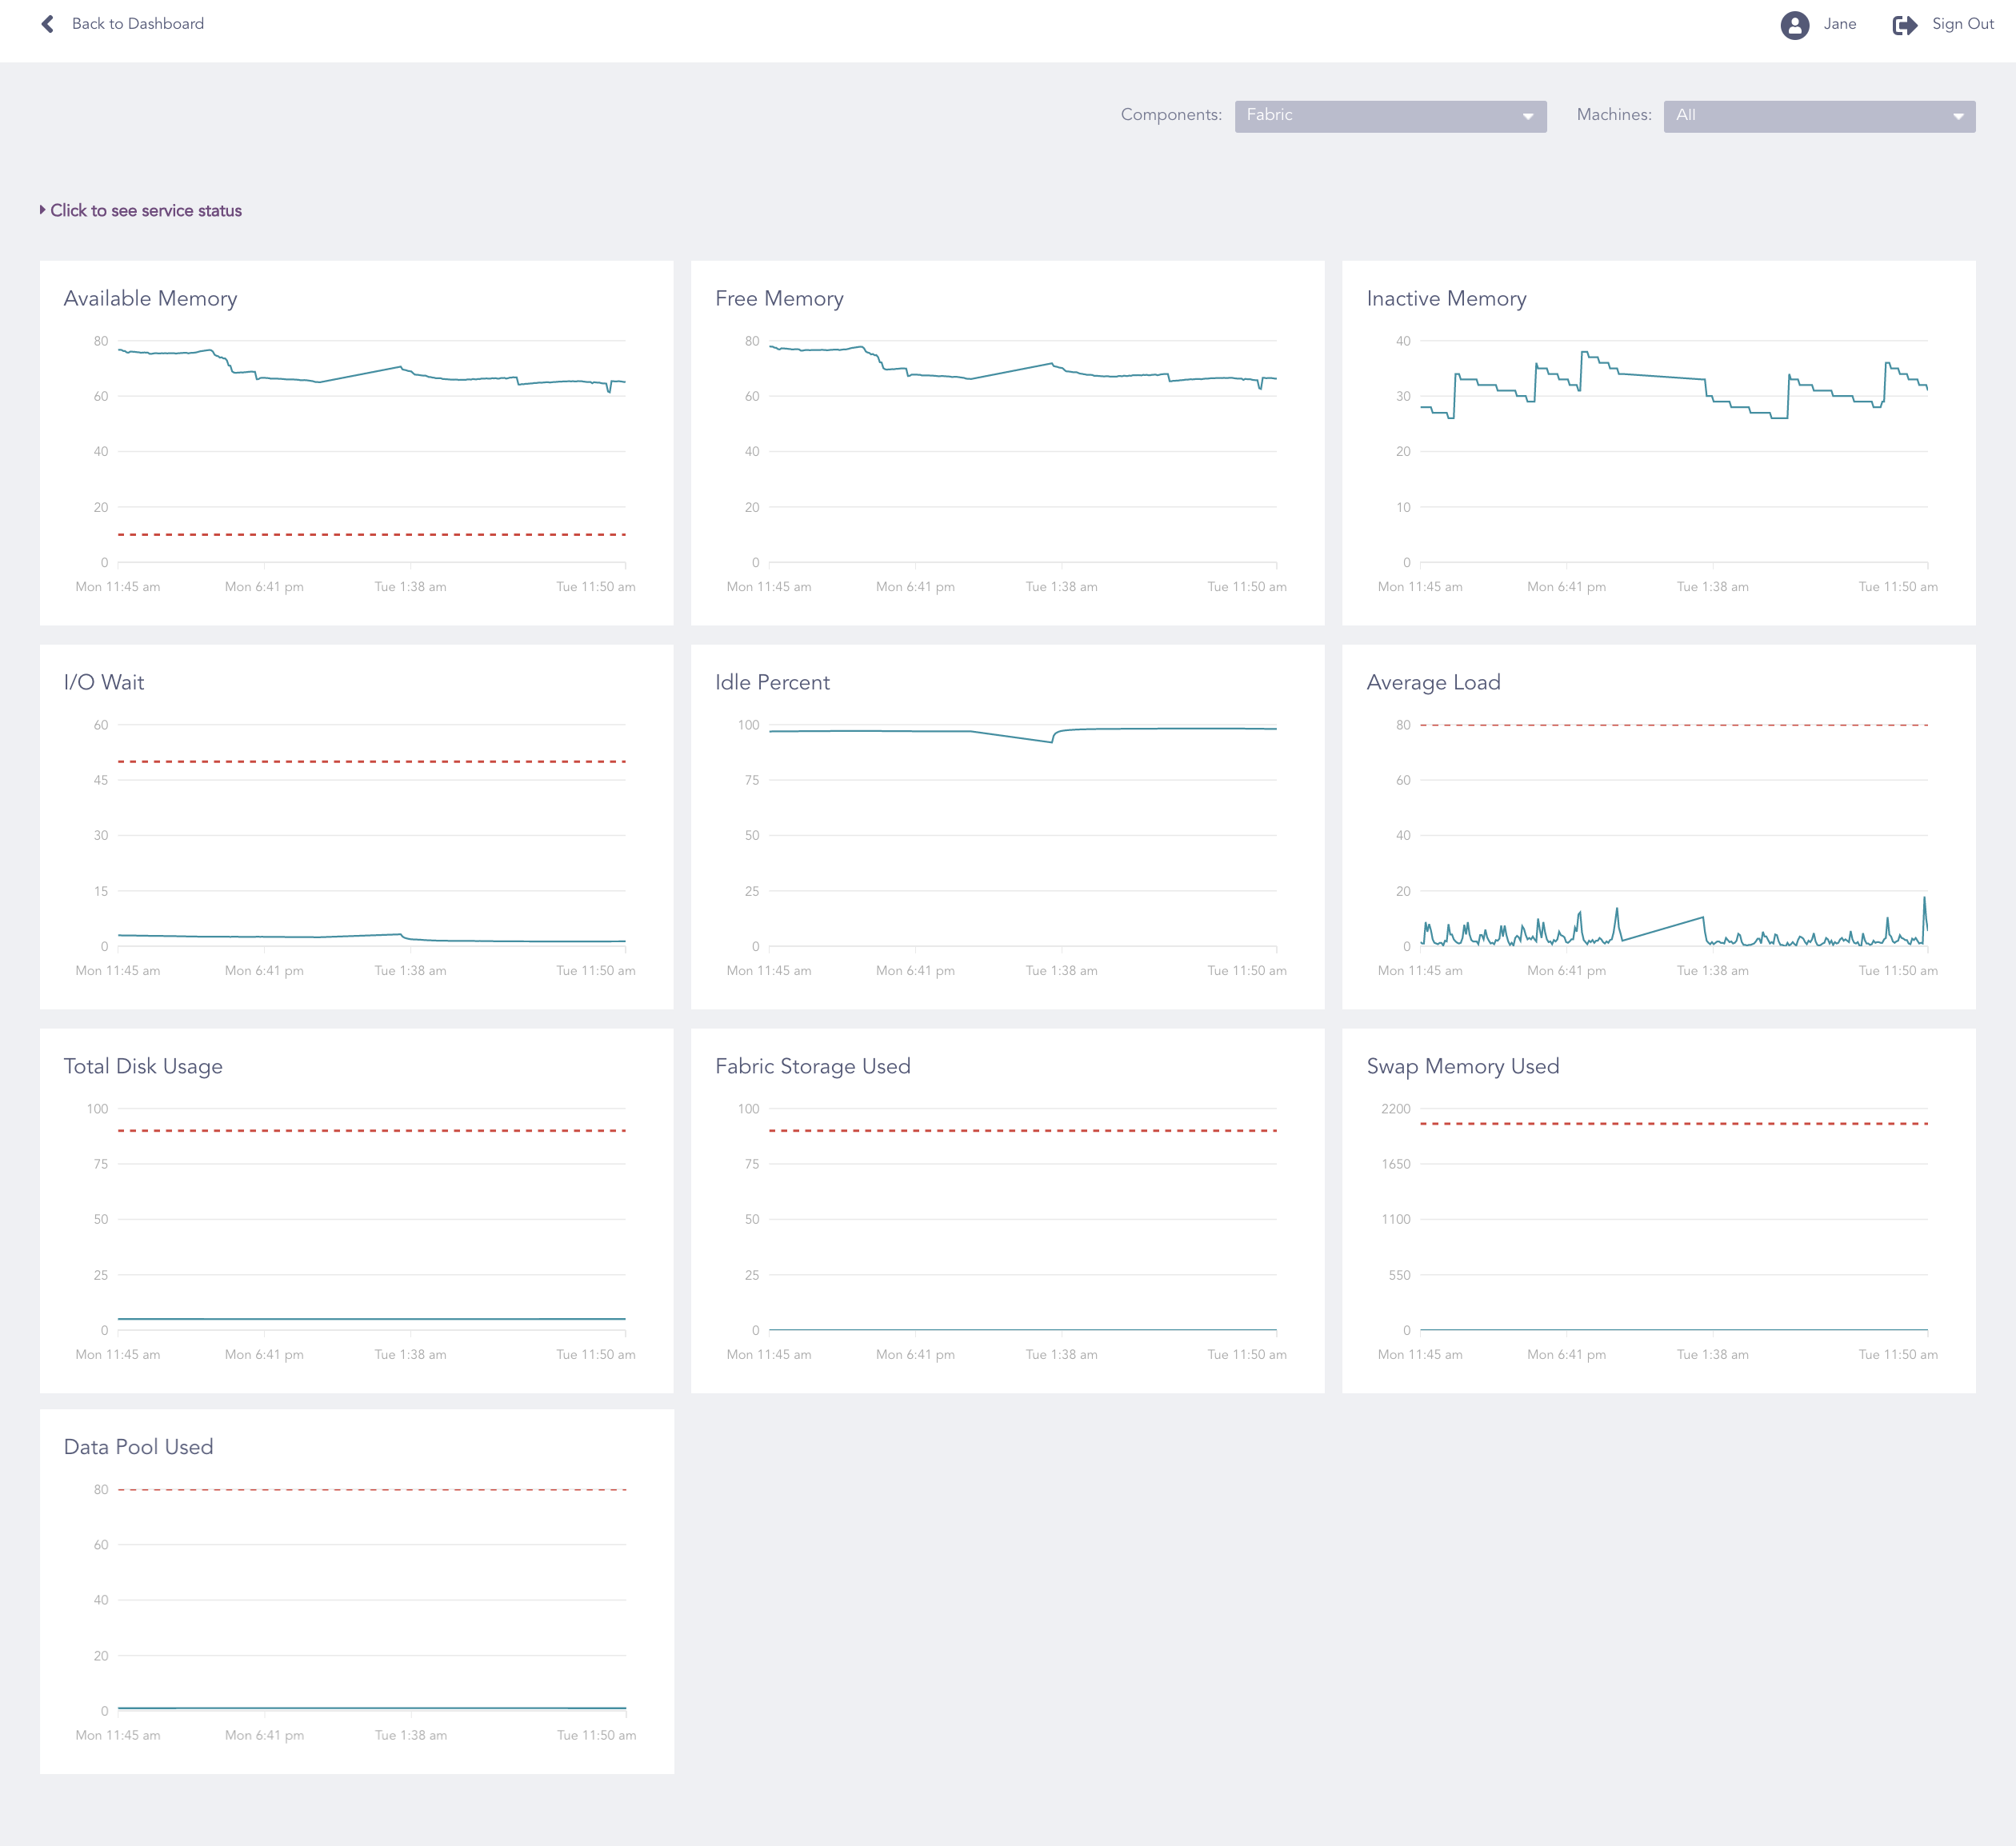
The parameters available in the Fabric widget are:
Fabric Parameter |
Description |
|---|---|
App Pool Health |
Shows whether the health of the partition that contains the application is online or not. |
Auth Admin Service |
Shows whether the administration service for the authentication mechanism is running or not. If it is offline, you cannot create pools in the Fabric Server. |
Auth Service |
Shows whether the authentication mechanism used by the Fabric Server is running or not. If it is offline for all the present Fabrics, you cannot perform any upload or install request from or to the Fabric Server. You also cannot create any pools while the Auth Service is in not online. |
Data Pool Health |
Shows whether the health of the partition that contains the application logs and Fabric Storage is online or not. |
Proxy Service |
Shows whether the Fabric Proxy is online or not. If it is offline for all the Fabric, you cannot send or receive any API requests and responses. |
R Pool Health |
Shows whether the health of the partition that contains the Operating System is online or not. |
Data Pool Used |
Shows the total percentage of Data Pool used by Fabric. |
Available Memory |
Shows the available memory that the system can use, which includes free memory and cached memory. |
Free Memory |
Shows the available memory after allocating the memory to all the available processes. |
I/O Wait |
Shows the time (in milliseconds) for which the CPU is idle while waiting for an I/O operation to complete. |
Idle Percent |
Shows of the CPU percentage that is unused for a particular time-frame. |
Inactive Memory |
Shows the total memory allocated to the processes that are no longer running. |
Average Load |
Shows the average value of the CPU load over the last five minutes. Only an entirely idle CPU has an average load of zero. |
Fabric Storage Used |
Shows the total percentage of the disk used for Fabric Storage. |
Swap Memory Used |
Shows the sum of swap ins and swap outs. Swap in is the number of memory the system reads from the swap device each second. Swap out is the number of memory the system writes to the swap device each second. |
Total Disk Usage |
Shows the total percentage of the disk used in the system. |
Warning
If the status of the App Pool Health, the Data Pool Health, or the R Pool Health parameters is not online, contact the LogPoint Support team.
Go to Dashboard.
Click Overview in the Fabric widget.
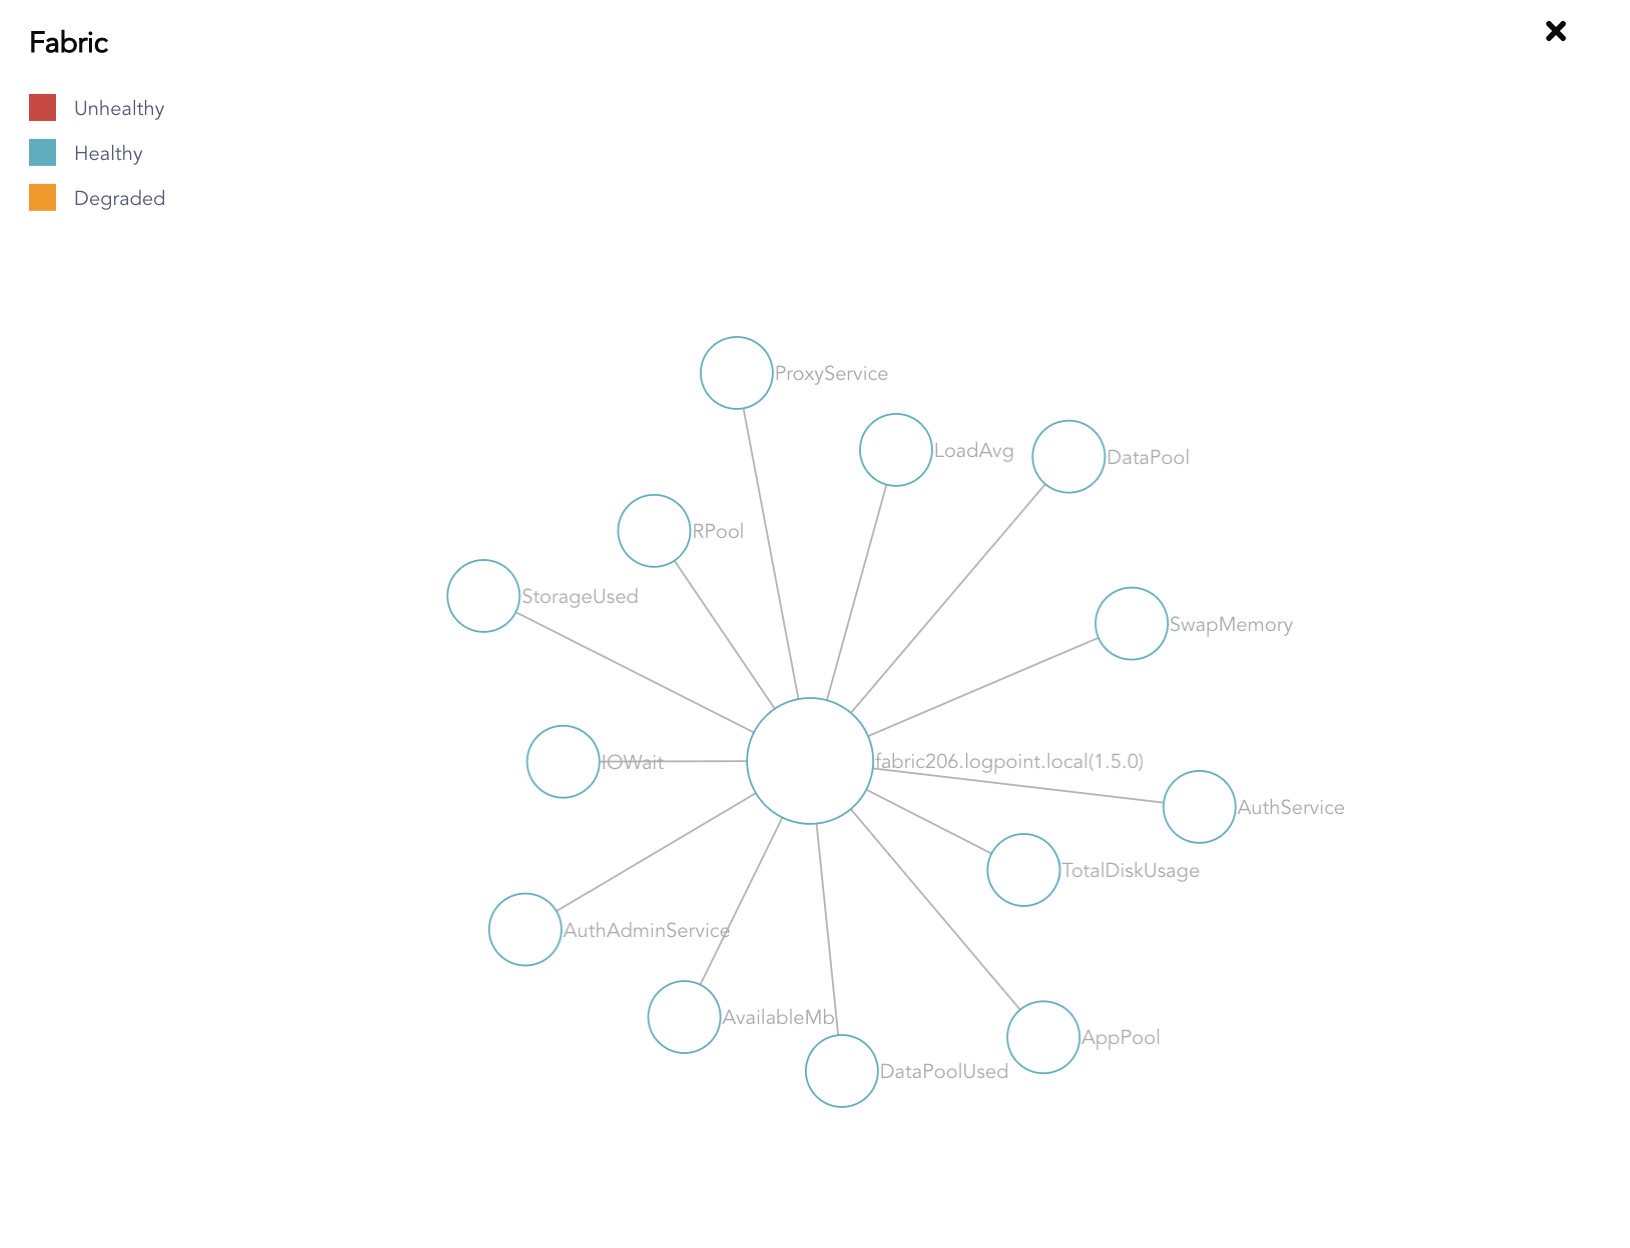
Fabric Overview
The Network Graph represents the Fabric and its 13 parameters.
Go to Dashboard.
Click the Configure ( ) icon in the Fabric widget.

Configure Fabric Icon
Enter the Duration and the Threshold values, and change the direction of each parameter as required.
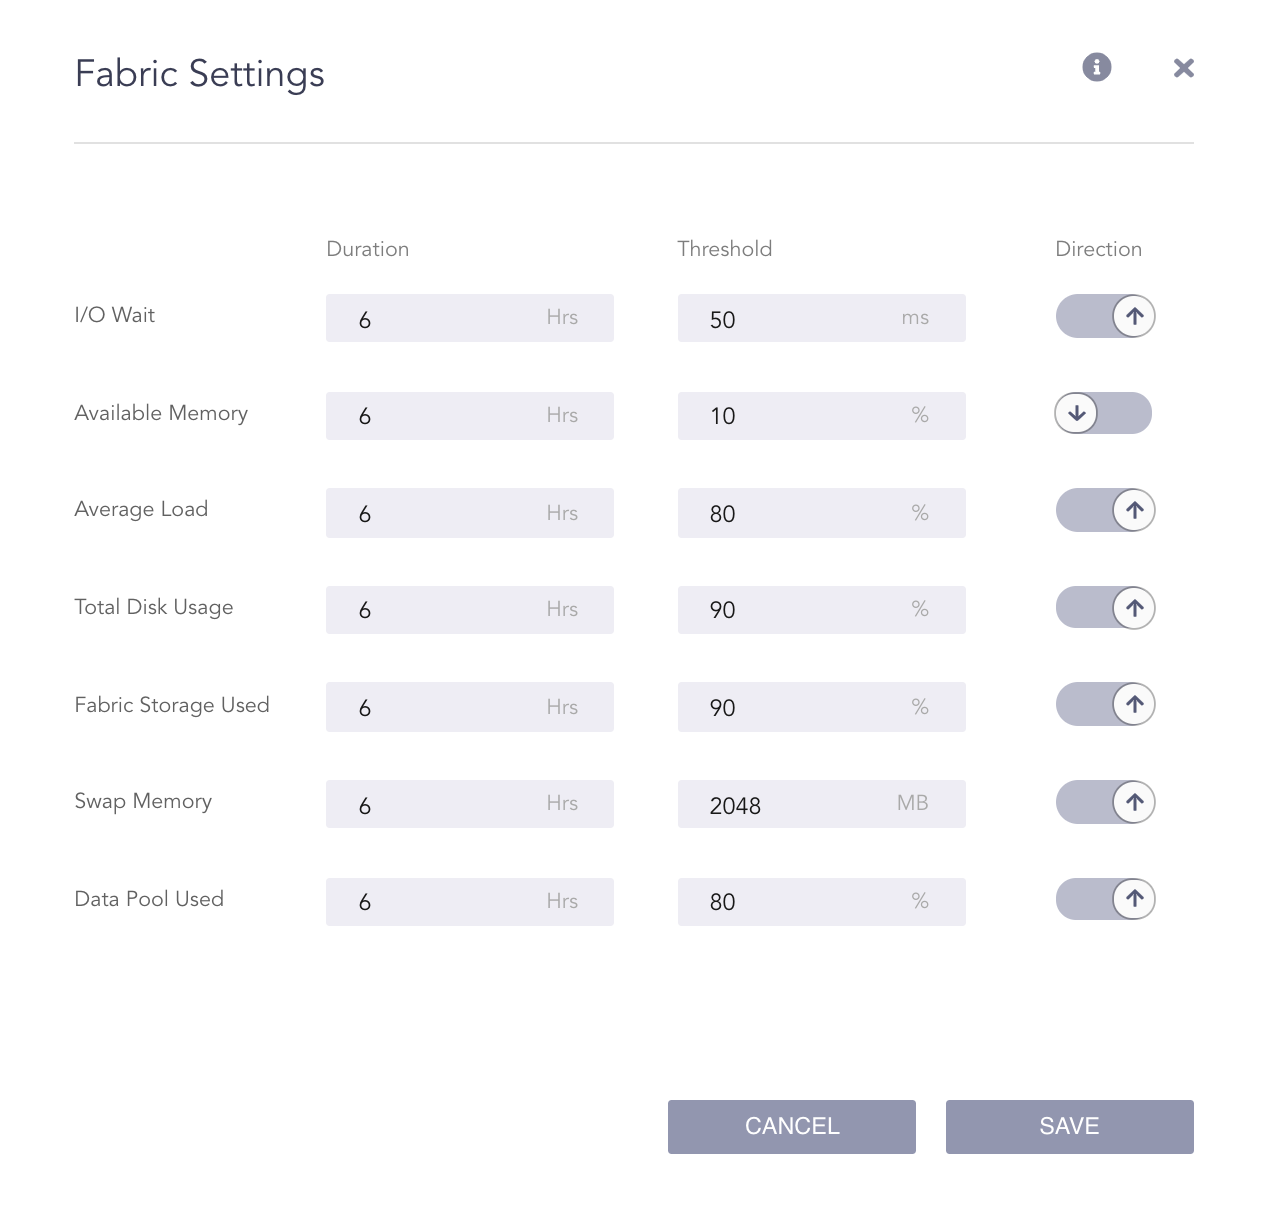
Configure Fabric Settings
In the screenshot above, the I/O Wait of the Fabric becomes unhealthy:
if it is more than 50 ms on average over the last 6 hours or
if it becomes more than 50 ms at any point of time over the last 6 hours.
Similarly, the Available Memory of the Fabric becomes unhealthy:
if it is less than 10% on average over the last 6 hours or
if it becomes less than 10% at any point of time over the last 6 hours.
Click Save.